Multiple Choice
The following frequency table summarizes the ages of 60 shoppers at the local grocery store. 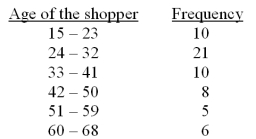 The sample mean for the above frequency table is calculated as 36.25.Calculate the approximate sample standard deviation for this data set.
A) 181.08
B) 184.15
C) 26.83
D) 13.46
E) 13.57
Correct Answer:

Verified
Correct Answer:
Verified
Q10: The population mean is the average of
Q21: The measurement in a sample or a
Q49: In a hearing test,subjects estimate the loudness
Q51: In a hearing test,subjects estimate the loudness
Q52: In a statistic class,10 scores were randomly
Q55: The local amusement park was interested in
Q55: Which percentile describes the first quartile,Q1?<br>A)25<sup>th</sup><br>B)50<sup>th</sup><br>C)75<sup>th</sup><br>D)100<sup>th</sup>
Q57: In a survey of 550 randomly-selected college
Q58: According to Chebyshev's theorem,how many standard deviations
Q109: Find the z-score for an IQ test