Multiple Choice
Using the following data,describe the shape of the data distribution. 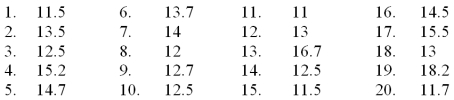
A) Skewed to the left
B) Bi-model
C) Normal
D) Skewed to the right
Correct Answer:

Verified
Correct Answer:
Verified
Related Questions
Q32: Row or column percentages can be found
Q46: The following is a relative frequency distribution
Q48: A histogram that tails out towards smaller
Q50: A histogram that tails out towards larger
Q50: The number of weekly sales calls by
Q52: Recently an advertising company called 200 people
Q53: A graphical portrayal of a data set
Q55: A plot of the values of two
Q56: The US local airport keeps track of
Q110: _ can be used to study the