Essay
Consider the following data on distances traveled by people to visit the local amusement park. 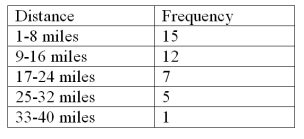 Construct an Ogive plot that corresponds to the frequency table.
Correct Answer:

Verified
Correct Answer:
Verified
Related Questions
Q60: The number of weekly sales calls by
Q71: When we wish to summarize the proportion
Q79: The number of weekly sales calls by
Q81: Which one of the following statistical tools
Q82: Which of the following graphs is for
Q83: All of the following are used to
Q85: Consider the following data on distances traveled
Q87: 822 customers were randomly selected from those
Q88: The number of items rejected daily by
Q119: The relative frequency is the frequency of