Multiple Choice
Refer to the information provided in Figure 14.1 below to answer the questions that follow.
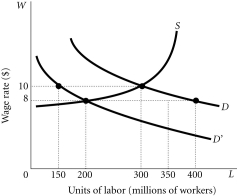 Figure 14.1
-Refer to Figure 14.1.Suppose there is a decrease in the fertility rate and this causes some men and women to place a lower value on their time spent in nonmarket activities.This will cause
A) the labor supply curve to shift to the left of S.
B) the labor supply curve to shift to the right of S.
C) the labor demand curve to shift from D to D'.
D) the labor demand curve to shift from D' to D.
Correct Answer:

Verified
Correct Answer:
Verified
Q16: If inflation expectations change as a result
Q25: The relative-wage explanation for the existence of
Q64: The economy experiences both inflation and unemployment
Q79: The social contract explanation for the existence
Q89: Refer to the information provided in Figure
Q90: Refer to the information provided in Figure
Q95: Refer to the information provided in Figure
Q118: The natural rate of unemployment is unemployment
Q146: Frictional unemployment is the type that arises
Q241: If the AD curve shifts from year