Multiple Choice
Use the diagram to answer the question.
The curve shows the position of an object with time.The object moves with a constant speed,v. 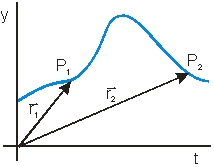
-Which of the vector diagrams below best represent the change in position vector from P1 to P2? 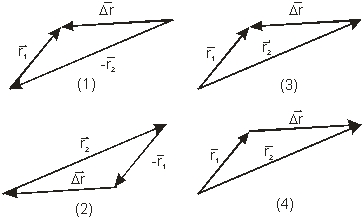
A) (1)
B) (2)
C) (3)
D) (4)
E) None of these is correct.
Correct Answer:

Verified
Correct Answer:
Verified
Related Questions
Q43: Which of the following statements is not
Q44: A car is traveling south at 30
Q45: A projectile was fired at 35º above
Q46: A ball is whirled in a horizontal
Q47: Use the following to answer the question:
Q49: You walk 12 km south and then
Q50: A rescue airplane is diving at
Q51: You walk 5 km north and then
Q52: Use the following to answer the question:
Q53: You shoot an arrow in a high