Multiple Choice
Use the diagram to answer the question.
The curve shows the position of an object with time.The object moves with a constant speed,v. 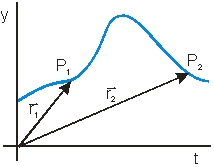
-Which of the vector diagrams below best represent the change in velocity vector from P1 to P2? 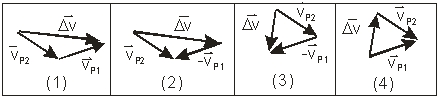
A) (1)
B) (2)
C) (3)
D) (4)
E) None of these is correct.
Correct Answer:

Verified
Correct Answer:
Verified
Related Questions
Q24: A vector has an x component of
Q25: If you ignore air resistance in projectile
Q26: The initial position and velocity of a
Q27: The initial position and velocity of a
Q28: A projectile is ejected from a 25-m
Q30: The position vector of an object is
Q31: A pilot wants the heading of an
Q32: The position vector locating the point P(12,-5)relative
Q33: Use the following to answer the question:
Q34: If a baseball is thrown at an