Multiple Choice
If you measure the force required to stretch a typical laboratory spring as a function of the amount of stretch,which of the graphs shown below would best represent your data? 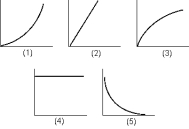
A) 1
B) 2
C) 3
D) 4
E) 5
Correct Answer:

Verified
Correct Answer:
Verified
Related Questions
Q42: The boom in the figure is uniform
Q43: A wire 2.5-m long has a
Q44: The horizontal bar in the figure will
Q45: A body is in translational equilibrium when<br>A)it
Q46: The bulk modulus B has units of<br>A)force.<br>B)energy.<br>C)pressure.<br>D)mass
Q48: A wire has a diameter of
Q49: Use the figure to the right to
Q50: A body is in mechanical equilibrium when<br>A)it
Q51: Use the following to answer the question:
Q52: Use the following to answer the question: