Multiple Choice
Use the following to answer question: 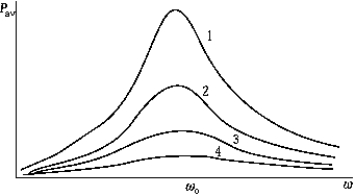
-The graph shows the average power delivered to an oscillating system as a function of the driving frequency.According to these data
A) the resonant frequency is greater than o.
B) the system corresponding to curve 1 has the smallest quality factor.
C) the system corresponding to curve 4 has the smallest quality factor.
D) the resonant frequency is less than o.
E) None of these is correct.
Correct Answer:

Verified
Correct Answer:
Verified
Q111: A physical pendulum oscillates with small amplitude
Q112: A 10-kg block starts from rest at
Q113: A body of mass M is executing
Q114: For a simple pendulum to have a
Q115: What is the amplitude after 1 s?<br>A)2
Q117: A body moving in simple harmonic motion
Q118: The displacement of a body moving with
Q119: A ball moves back and forth in
Q120: When driving over a washboard speed bumps,certain
Q121: Use the following to answer the