Multiple Choice
Use the following to answer the question: 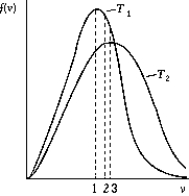
-The figure shows the distribution of the molecular speeds of a gas for two different temperatures.
A) The curve labeled T1 represents the distribution for the higher temperature molecules.
B) The point labeled "1" corresponds to the rms speed of the molecules whose temperature is T1.
C) The point labeled "2" corresponds to the maximum speed of the molecules whose temperature is T1.
D) The point labeled "3" corresponds to the average speed of the molecules whose temperature is T1.
E) None of these is correct.
Correct Answer:

Verified
Correct Answer:
Verified
Q39: You can double both the pressure and
Q40: If you carry a sealed cylinder of
Q41: A thermometer is constructed by filling
Q42: Doubling the Kelvin temperature of a gas
Q43: Which of the following statements about the
Q45: If you plot a graph with Fahrenheit
Q46: In a vacuum system,a container is
Q47: At what common Celsius temperature is the
Q48: A temperature difference of 5 Cº is
Q49: If both the temperature and the volume