Multiple Choice
Use the following to answer the question: 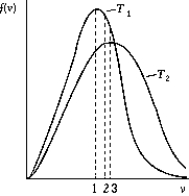
-The figure shows the distribution of the molecular speeds of a gas for two different temperatures.
A) The curve labeled T1 represents the distribution for the higher temperature molecules.
B) The point labeled "1" corresponds to the maximum speed of the molecules whose temperature is T1.
C) The point labeled "2" corresponds to the maximum speed of the molecules whose temperature is T1.
D) The point labeled "3" corresponds to the average speed of the molecules whose temperature is T1.
E) None of these is correct.
Correct Answer:

Verified
Correct Answer:
Verified
Q9: A gas has a density X at
Q10: Two monoatomic gases,helium and neon,are mixed
Q11: A large balloon is being filled
Q12: If the rms speed of nitrogen molecules
Q13: At room temperature,which of the following diatomic
Q15: If the pressure and volume of an
Q16: A collection of oxygen molecules occupies a
Q17: A mass of He gas occupies a
Q18: If the rms speed of oxygen molecules
Q19: The temperature at which the Celsius and