Multiple Choice
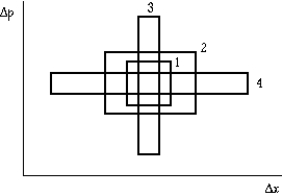 The graph shows the uncertainty in measuring the position x and momentum p of a particle in four experiments. Region 1 has area h, region 2 has area 4h, region 3 has area 2h, and region 4 has area 3h. The region that correctly represents the uncertainty principle is
A) 1
B) 2
C) 3
D) 4
E) All of these are correct.
Correct Answer:

Verified
Correct Answer:
Verified
Q2: The pupil area of the human
Q11: An electron in the hydrogen atom (ground-state
Q14: The Davisson and Germer experiment verified that<br>A)the
Q30: An electron is in a one-dimensional box
Q44: An electron is in a one-dimensional box
Q52: If the work function of thoriated
Q62: The dissociation energy is the energy
Q70: Light falling on the surface of a
Q92: A classical particle<br>A)exhibits interference.<br>B)exhibits diffraction.<br>C)has energy associated
Q111: The wave function for sound waves