Multiple Choice
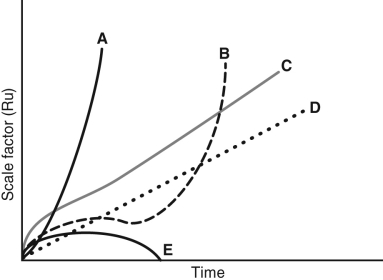 Figure 1
-Figure 1 shows five graphs of the scale factor of the universe as a function of time. Which of these graphs would occur for a universe with mass 1 and 1 = 0?
A) A
B) B
C) C
D) D
E) E
Correct Answer:

Verified
Correct Answer:
Verified
Q30: In some particle physics theories, the universe
Q62: <img src="https://d2lvgg3v3hfg70.cloudfront.net/TB4371/.jpg" alt=" Figure
Q63: Current observations suggest that the density
Q64: A grand unified theory unites which forces?<br>A)
Q66: In the superstring theory that successfully unites
Q68: If the fate of the universe were
Q69: Observations of Type I supernovae in distant
Q70: If dark energy is currently causing the
Q71: According to superstring theory, how are different
Q72: What is the difference between a grand