Multiple Choice
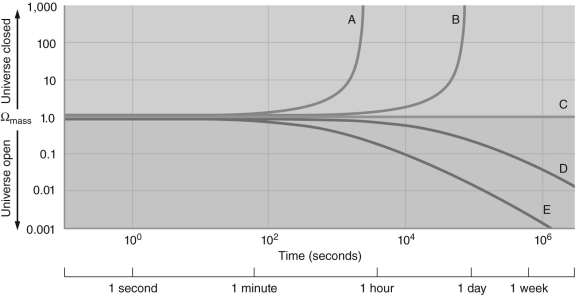 Figure 2
-Figure 2 shows a graph of the value of mass as a function of time in a universe with no dark energy. The five different curves correspond to universes with slightly different values for mass one second after the Big Bang. Which line corresponds to a universe with the largest value of mass one second after the Big Bang?
A) A
B) B
C) C
D) D
E) E
Correct Answer:

Verified
Correct Answer:
Verified
Q1: Grand unified theories are very attractive because
Q2: Which was a triumph of quantum electrodynamics
Q4: The standard model of particle physics is
Q5: Why does the sum of
Q6: Dark energy is a force that continually
Q7: Why would it be very improbable
Q8: Describe the four fundamental forces of nature
Q9: Put the following types of objects in
Q10: Which of the following is FALSE?<br>A) When
Q11: <img src="https://d2lvgg3v3hfg70.cloudfront.net/TB4371/.jpg" alt=" Figure