Multiple Choice
A graph of class data is below. What is this type of graph called? 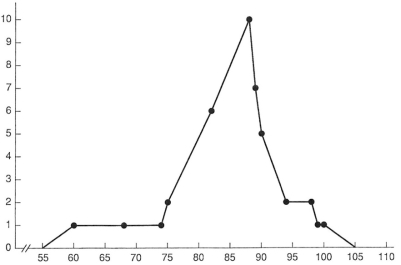
A) Frequency distribution
B) Normal distribution
C) Bell curve
D) Frequency polygon
Correct Answer:

Verified
Correct Answer:
Verified
Related Questions
Q1: What is a normal distribution and why
Q4: When the mean score is represented as
Q13: In a normal distribution, most students' scores
Q27: Using the data set below,answer the
Q45: Using the data set below, answer the
Q47: In order for a score to be
Q48: Draw pictures of a negatively skewed distribution
Q53: Define and provide an example of the
Q57: This term is used when a national
Q58: Large sets of data are organized and