Multiple Choice
In the graph below, which of the following represents (1) the curve that describes the changes in ratio of nuclear volume to cytoplasmic volume during the cleavage stage of development; and (2) the correct statement about the changes in size of the blastomeres during that stage? 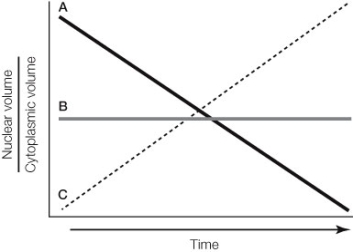
A) Curve A; blastomeres decrease in size
B) Curve B; blastomeres decrease in size
C) Curve C; blastomeres decrease in size
D) Curve A; blastomeres increase in size
E) Curve C; blastomeres increase in size
Correct Answer:

Verified
Correct Answer:
Verified
Q123: Refer to the diagram below, showing
Q124: Refer to the diagram below. What is
Q125: The mesoderm contributes tissue to the<br>A) skin,
Q126: The mesoderm of the vertebrate embryo is
Q127: Which of the following does not occur
Q129: The somites are derived from _ tissue.<br>A)
Q130: Fertilization involves all of the following except<br>A)
Q131: Which of the following statements about the
Q132: Which of the following statements about fertilization
Q133: A body plan consisting of repeating segments,