Multiple Choice
The graph below shows the range of variation among population members for a trait determined by multiple genes. 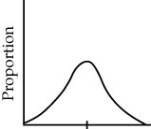 If this population is subject to stabilizing selection for several generations, which of the distributions would be most likely to result?
A) 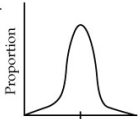
B) 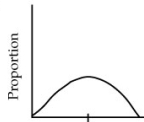
C) 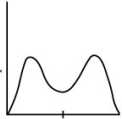
D) 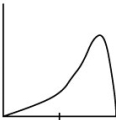
E) Both a and b
Correct Answer:

Verified
Correct Answer:
Verified
Q80: In Tim Birkhead's study of zebra finches,
Q81: Which of the following statements about the
Q82: Evolutionary changes in the _ protein on
Q83: Under Hardy-Weinberg equilibrium, if the frequency of
Q84: Which of the following statements about mutations
Q86: Mutations<br>A) are any change in an organism's
Q87: Which of the following is a plausible
Q88: Suppose that a particular species of flowering
Q89: Which of the following statements about population
Q90: Laboratory selection experiments with fruit flies have