Essay
Consider the following set of quarterly sales data,given in thousands of dollars. 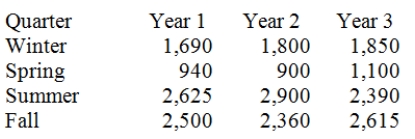 The following dummy variable model that incorporates a linear trend and constant seasonal variation was used: y(t)= B0 + B1t + BQ1(Q1)+ BQ2(Q2)+ BQ3(Q3)+ Et.In this model,there are 3 binary seasonal variables (Q1,Q2,and Q3),where Qi is a binary (0,1)variable defined as:
Qi = 1,if the time series data is associated with quarter i;
Qi = 0,if the time series data is not associated with quarter i.The results associated with this data and model are given in the following Minitab computer output.The regression equation is
Sales = 2442 + 6.2Time − 693Q1 − 1499Q2 + 153Q3 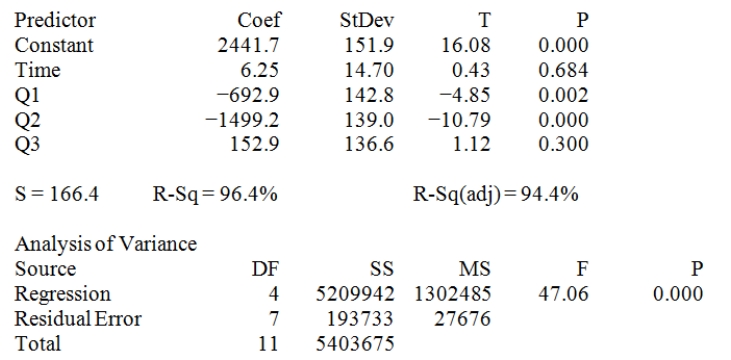 Provide a managerial interpretation of the regression coefficients for the variables Q1 (quarter 1),Q2 (quarter 2),and Q3 (quarter 3).
Correct Answer:

Verified
Excluding trend,estimated sales in quart...View Answer
Unlock this answer now
Get Access to more Verified Answers free of charge
Correct Answer:
Verified
View Answer
Unlock this answer now
Get Access to more Verified Answers free of charge
Q90: Dummy variable regression would be an appropriate
Q91: Multiplicative decompositions assumes that time series components
Q94: Two forecasting models were used to predict
Q98: Given the following data,compute the mean squared
Q100: Consider the quarterly production data (in thousands
Q101: Consider the following data. <img src="https://d2lvgg3v3hfg70.cloudfront.net/TB2569/.jpg" alt="Consider
Q129: Simple exponential smoothing is a forecasting method
Q133: The Box-Jenkins methodology can be used to
Q148: A sequence of values of some variable
Q158: Simple exponential smoothing is an appropriate method