Essay
Consider the following set of quarterly sales data,given in thousands of dollars.  The following dummy variable model that incorporates a linear trend and constant seasonal variation was used: y(t)= B0 + B1t + BQ1(Q1)+ BQ2(Q2)+ BQ3(Q3)+ Et.In this model,there are 3 binary seasonal variables (Q1,Q2,and Q3),where Qi is a binary (0,1)variable defined as:
Qi = 1,if the time series data is associated with quarter i;
Qi = 0,if the time series data is not associated with quarter i.The results associated with this data and model are given in the following Minitab computer output.The regression equation is
Sales = 2442 + 6.2 Time − 693 Q1 − 1499 Q2 + 153 Q3 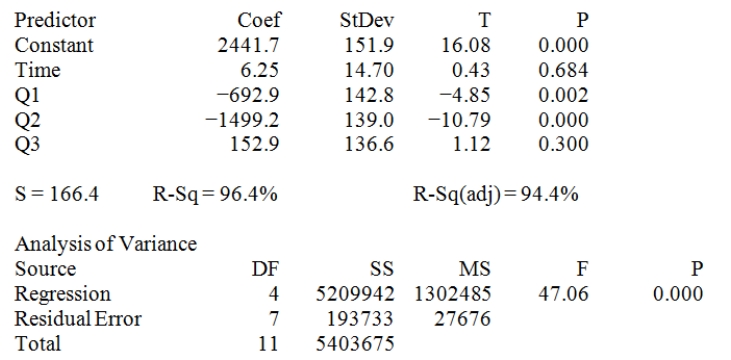 Provide a managerial interpretation of the regression coefficient for the variable "time."
Correct Answer:

Verified
It is estimated that...View Answer
Unlock this answer now
Get Access to more Verified Answers free of charge
Correct Answer:
Verified
View Answer
Unlock this answer now
Get Access to more Verified Answers free of charge
Q5: A positive autocorrelation implies that negative error
Q9: A univariate time series model is used
Q41: In general, the number of dummy variables
Q72: Given the following data,compute the total error
Q96: Exponential smoothing is a forecasting method that
Q115: A simple exponential forecasting method would not
Q116: The Durbin-Watson statistic is used to detect
Q119: Cyclical variation exists when the magnitude of
Q125: When deseasonalizing a time series observation, we
Q140: Dummy variables are used to model increasing