Essay
The following frequency table summarizes the ages of 60 shoppers at the local farmer's market. 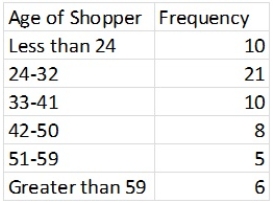 The estimated mean is 36.25,and estimated standard deviation is 13.57.Calculate the probability for each interval,assuming a normal distribution.
Correct Answer:

Verified
 _TB2569_00 Each probability is...
View Answer
Unlock this answer now
Get Access to more Verified Answers free of charge
Correct Answer:
Verified
View Answer
Unlock this answer now
Get Access to more Verified Answers free of charge
Q16: In performing a chi-square test of independence,
Q22: The HR manager of a major office
Q24: The HR manager of a major office
Q28: The distance (in thousands of miles)traveled by
Q29: In performing a chi-square goodness-of-fit test with
Q30: The chi-square goodness-of-fit test will be valid
Q31: Consider the 3 × 2 contingency table
Q53: When using a chi-square goodness-of-fit test with
Q91: A manufacturing company produces part QV2Y for
Q100: While a binomial distribution describes count data