Essay
Consider the following data on distances traveled by people to visit the local amusement park. 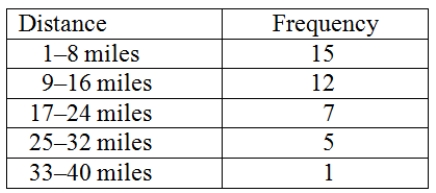 Construct an ogive plot that corresponds to the frequency table.
Correct Answer:

Verified
Correct Answer:
Verified
Related Questions
Q22: The number of items rejected daily by
Q23: Consider the following data. <img src="https://d2lvgg3v3hfg70.cloudfront.net/TB2569/.jpg" alt="Consider
Q26: The following is a relative frequency distribution
Q30: Math test anxiety can be found throughout
Q31: An example of manipulating a graphical display
Q37: The number of measurements falling within a
Q65: All of the following are used to
Q71: When we wish to summarize the proportion
Q103: Splitting the stems refers to assigning the
Q119: The relative frequency is the frequency of