Essay
The following is a relative frequency distribution of grades in an introductory statistics course. 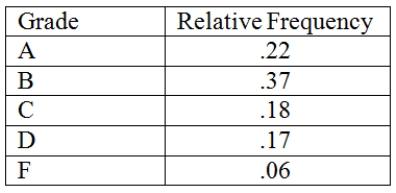 If we wish to depict these data using a pie chart,find how many degrees (out of 360 degrees)should be assigned to each grade.
Correct Answer:

Verified
Correct Answer:
Verified
Related Questions
Q5: Gauges feature a single measure showing variation
Q6: Recently an advertising company called 200 people
Q7: A local electronics retailer recently conducted a
Q13: A flaw possessed by a population or
Q14: The number of items rejected daily by
Q20: Leaves on a stem-and-leaf display should be
Q32: As a business owner, I have requested
Q67: Which of the following graphs is for
Q78: Which of the following graphical tools is
Q91: A runs plot is a form of