Essay
Looking at the runs plot of gasoline prices over the past 30 months,describe what it tells us about the price of gas during these 30 months. 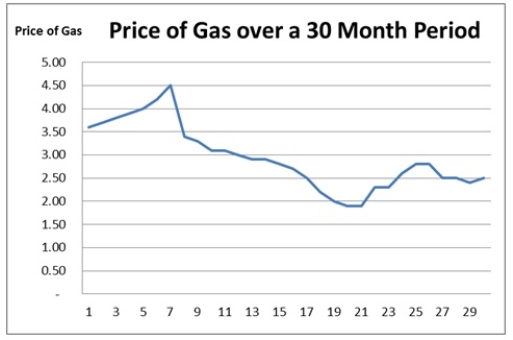
Correct Answer:

Verified
The price of gas peaked in the seventh m...View Answer
Unlock this answer now
Get Access to more Verified Answers free of charge
Correct Answer:
Verified
The price of gas peaked in the seventh m...
View Answer
Unlock this answer now
Get Access to more Verified Answers free of charge
Related Questions
Q18: Methods for obtaining a sample are called<br>A)
Q28: _ refers to describing the important aspects
Q36: By taking a systematic sample in which
Q45: Any characteristic of an element is called
Q48: Which of the following is a type
Q50: A(n) _ variable can have values that
Q61: The process of assigning a value of
Q87: When we are choosing a random sample
Q93: Measurements from a population are called<br>A) elements.<br>B)
Q95: Time series data are data collected at