Multiple Choice
Exhibit 6-2
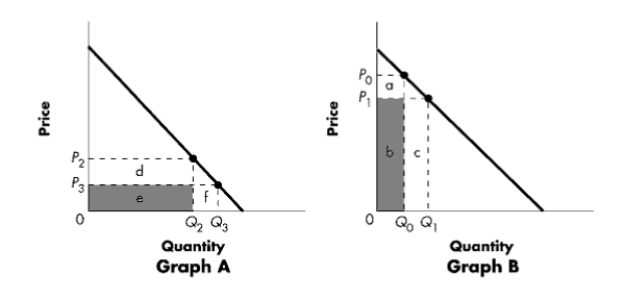
-Refer to Exhibit 6-2. Elasticity varies along a linear demand curve. Graph A represents the section of the curve where:
A) the curve is inelastic.
B) Ed is < 1.
C) starting at P2, a decrease in price will lead to a decrease in total revenue.
D) all of the above are correct.
Correct Answer:

Verified
Correct Answer:
Verified
Q235: Put the following products in order from
Q236: If a cut in prices increases total
Q237: Exhibit 6-2<br> <img src="https://d2lvgg3v3hfg70.cloudfront.net/TB5768/.jpg" alt="Exhibit 6-2
Q238: If the cross price elasticity of demand
Q239: A positive income elasticity of demand for
Q241: The elasticity of supply is defined as
Q242: Evaluate the following statements: <br>I.The slope of
Q243: The long run demand curve for wheat
Q244: The government proposes a tax on flowers
Q245: In the graph below, a tax increase