Multiple Choice
Exhibit 6-3
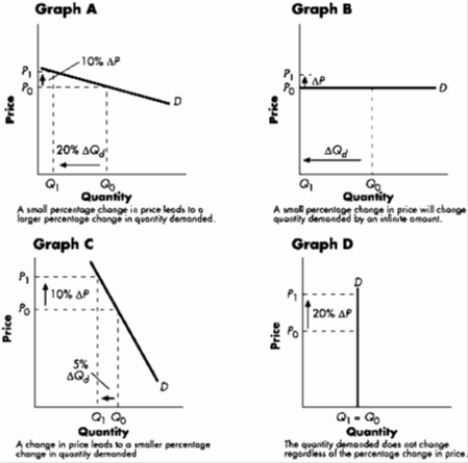
-Refer to Exhibit 6-3. The graph that best illustrates a perfectly elastic demand curve is
A) Graph A.
B) Graph B.
C) Graph C.
D) Graph D.
Correct Answer:

Verified
Correct Answer:
Verified
Related Questions
Q169: If the price elasticity of demand was
Q170: A good is considered normal when its
Q171: Assume an industry initially in equilibrium has
Q172: Butch's Barber Shop knows that it faces
Q173: The elasticity of supply coefficient for lobster
Q175: If a price decrease leads to an
Q176: The price of a new electronic toy
Q177: Which of the following goods would be
Q178: Calculate the income elasticity of demand for
Q179: To determine whether or not a pair