Multiple Choice
Exhibit 6-3
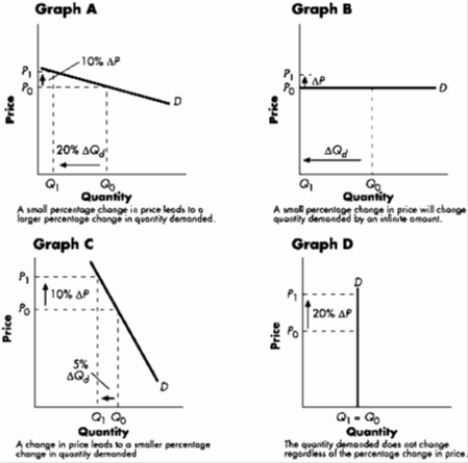
-Refer to Exhibit 6-3. The graph that best illustrates a relatively inelastic (but not perfectly inelastic) range along a demand curve is:
A) Graph A.
B) Graph B.
C) Graph C.
D) Graph D.
Correct Answer:

Verified
Correct Answer:
Verified
Related Questions
Q6: If the price elasticity coefficient equals 4.2,
Q7: Total revenue for a seller represents the
Q8: Demand is said to be _ when
Q10: The current supply of Rembrandt paintings:<br>A)is perfectly
Q12: If the measured elasticity of supply coefficient
Q13: The government proposes a tax on flowers
Q14: Say that a consumer's income elasticity of
Q15: A tax is imposed on orange juice.
Q16: If Pizza Hut decreases its price for
Q125: Demand for a good is said to