Multiple Choice
Exhibit 6-4 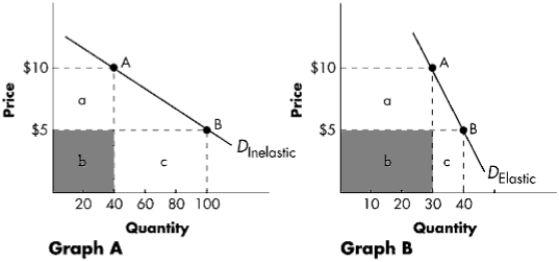
-Refer to Exhibit 6-4. With reference to Graph A, at a price of $10, total revenue equals:
A) $200.
B) $400.
C) $500.
D) $1,000.
Correct Answer:

Verified
Correct Answer:
Verified
Related Questions
Q222: As you move down a demand curve,
Q223: A decrease in price will cause a
Q224: If the supply curve for housing is
Q225: Exhibit 6-4 <img src="https://d2lvgg3v3hfg70.cloudfront.net/TB5768/.jpg" alt="Exhibit 6-4
Q226: As the time to respond to a
Q228: If a huge percentage change in price
Q229: The nation's largest cable TV company tested
Q230: If the demand for a good is
Q231: If the cross price elasticity between Goods
Q232: A tax is imposed on wine. Sellers