Multiple Choice
Exhibit 6-4 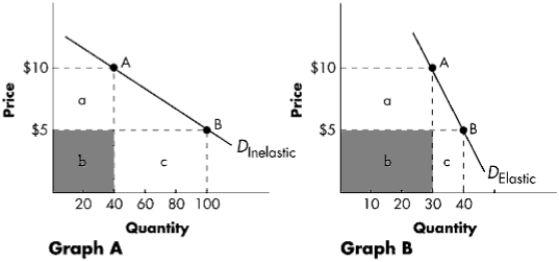
-Refer to Exhibit 6-4. With reference to Graph A, at a price of $5, total revenue equals:
A) $200.
B) $400.
C) $500.
D) $1,000.
Correct Answer:

Verified
Correct Answer:
Verified
Related Questions
Q22: For a given increase in price, a
Q23: For a given, permanent reduction in demand
Q24: If the elasticity of supply coefficient for
Q25: The price elasticity of demand for tickets
Q26: In the graph below, a tax increase
Q28: Moving along an elastic portion of a
Q29: In a recent fare war, America West
Q30: If the price elasticity of demand for
Q31: When a 5% increase in price leads
Q32: If the measured elasticity of supply coefficient