Multiple Choice
Exhibit 6-4 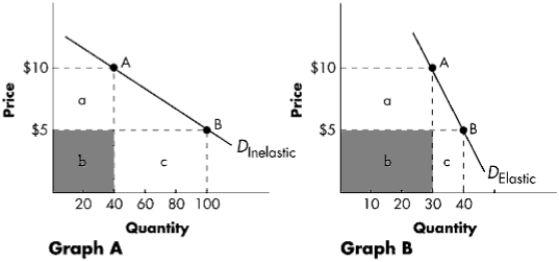
-Refer to Exhibit 6-4. Graph B represents a demand curve that is relatively ____in the range illustrated. Total revenue ____ as the price decreases from $10 to $5.
A) inelastic; decreases
B) elastic; decreases
C) elastic; increases
D) inelastic; increases
Correct Answer:

Verified
Correct Answer:
Verified
Related Questions
Q89: If you and your business partner are
Q90: If the cross elasticity of demand coefficient
Q91: When demand and income move in the
Q92: The longer the time buyers have to
Q93: A recent study at a liberal arts
Q95: If a good has a perfectly inelastic
Q96: If the elasticity of demand for bagels
Q97: If the short run elasticity of supply
Q98: An increase in demand will increase total
Q99: A tax is imposed on orange juice.