Multiple Choice
The graph below depicts a(n) : 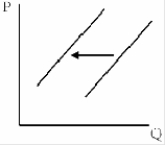
A) supply increase.
B) supply decrease.
C) decrease in demand.
D) increase in demand.
Correct Answer:

Verified
Correct Answer:
Verified
Related Questions
Q7: Starting from an equilibrium position,<br>A)the imposition of
Q8: If the price of a good increased,<br>A)It
Q9: When the demand for grapes decreases and
Q10: Suppose the United States steps up efforts
Q11: Which of the following would cause a
Q13: For the price in a market to
Q14: Assume a price floor is imposed at
Q15: If both the supply and demand curves
Q17: Exhibit 5-10 <img src="https://d2lvgg3v3hfg70.cloudfront.net/TB5768/.jpg" alt="Exhibit 5-10
Q305: A binding price ceiling causes a shortage