menu-iconExamlexExamLexServices

Discover

Ask a Question
  1. All Topics
  2. Topic
    Business
  3. Study Set
    Exploring Economics Study Set 1
  4. Exam
    Exam 4: Demand, Supply, and Market Equilibrium
  5. Question
    Exhibit 4-2 -Refer to Exhibit 4-2. Using the Graph and Beginning on and Beginning
Solved

Exhibit 4-2 -Refer to Exhibit 4-2. Using the Graph and Beginning on and Beginning

Question 209

Question 209

Multiple Choice

Exhibit 4-2 Exhibit 4-2   -Refer to Exhibit 4-2. Using the graph and beginning on D<sub>1</sub>, a shift to D<sub>0</sub> would indicate a(n) : A) ​increase in demand. B) ​decrease in demand. C) ​increase in quantity demanded. D) ​decrease in quantity demanded.
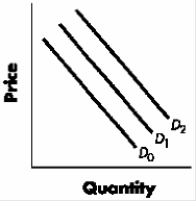
-Refer to Exhibit 4-2. Using the graph and beginning on D1, a shift to D0 would indicate a(n) :


A) ​increase in demand.
B) ​decrease in demand.
C) ​increase in quantity demanded.
D) ​decrease in quantity demanded.

Correct Answer:

verifed

Verified

Unlock this answer now
Get Access to more Verified Answers free of charge

Related Questions

Q22: If a shortage exists in a market,then

Q157: The quantity supplied of a good is

Q204: A supply schedule shows:<br>A)​projected sales as ad

Q205: ​Exhibit 4-4 <img src="https://d2lvgg3v3hfg70.cloudfront.net/TB5768/.jpg" alt="​Exhibit 4-4

Q210: ​Exhibit 4-6 <img src="https://d2lvgg3v3hfg70.cloudfront.net/TB5768/.jpg" alt="​Exhibit 4-6

Q211: If Eric expects to earn more income

Q212: Which of the following is true?<br>A)​A fall

Q213: If Diet Pepsi and Diet Coke are

Q214: At the equilibrium price for gasoline:<br>A)​everyone with

Q299: Which of the following would be most

Examlex

ExamLex

About UsContact UsPerks CenterHomeschoolingTest Prep

Work With Us

Campus RepresentativeInfluencers

Links

FaqPricingChrome Extension

Download The App

Get App StoreGet Google Play

Policies

Privacy PolicyTerms of ServiceHonor CodeCommunity Guidelines

Scan To Download

qr-code

Copyright © (2025) ExamLex LLC.

Privacy PolicyTerms Of ServiceHonor CodeCommunity Guidelines