Multiple Choice
In the graph of the circular flow model below, area C represents 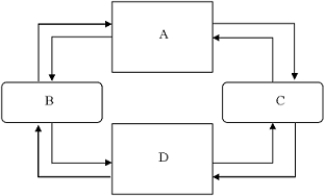
A) product markets.
B) firms.
C) factor markets.
D) households.
Correct Answer:

Verified
Correct Answer:
Verified
Q94: The degree of government involvement in the
Q95: Exhibit 3-3 <img src="https://d2lvgg3v3hfg70.cloudfront.net/TB5768/.jpg" alt="Exhibit 3-3
Q96: Which of the following would mostly likely
Q97: Which of the following would be most
Q98: Exhibit 3-15 <img src="https://d2lvgg3v3hfg70.cloudfront.net/TB5768/.jpg" alt="Exhibit 3-15
Q100: How can we measure the opportunity cost
Q101: What are the factors that can cause
Q102: Suppose Freeland produces few consumption goods and
Q103: Exhibit 3-13 <img src="https://d2lvgg3v3hfg70.cloudfront.net/TB5768/.jpg" alt="Exhibit 3-13
Q104: Which of the following is NOT illustrated