Multiple Choice
Exhibit 20.8.A sports agent wants to understand the differences in the annual earnings of players in different sports.The below table shows the annual earnings (in million dollars) of 52 athletes.For the Kruskal-Wallis test,the rank sums for each group are at the bottom of the table. 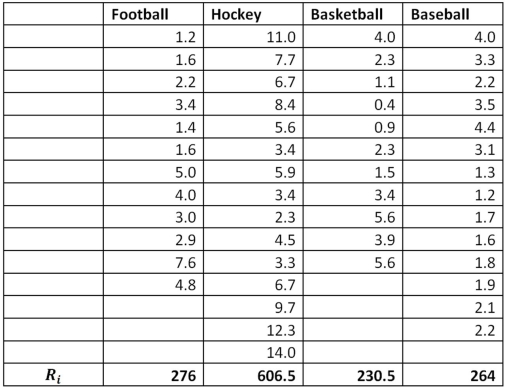 Refer to Exhibit 20.8.For the Kruskal-Wallis test,the competing hypotheses are:
A)  ,
, 
B) 
C)  ,
, 
D) 
Correct Answer:

Verified
Correct Answer:
Verified
Q41: The Kruskal-Wallis test is the nonparametric alternative
Q42: Exhibit 20.7.A marketing firm needs to replace
Q43: Exhibit 20.8.A sports agent wants to understand
Q44: Exhibit 20.3.A company which produces financial accounting
Q47: The nonparametric test for two population medians
Q48: Exhibit 20.2.A trading magazine wants to determine
Q49: Exhibit 20.11.A wine magazine wants to know
Q50: Exhibit 20.4.Investment institutions usually have funds with
Q52: Exhibit 20.4.Investment institutions usually have funds with
Q72: Parametric tests typically assume the underlying population