Multiple Choice
Exhibit 18.3.The following table shows the annual revenues (in millions of dollars) of a pharmaceutical company over the period 1990-2011. 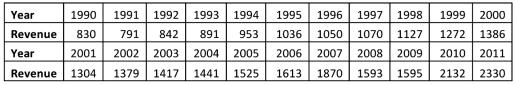
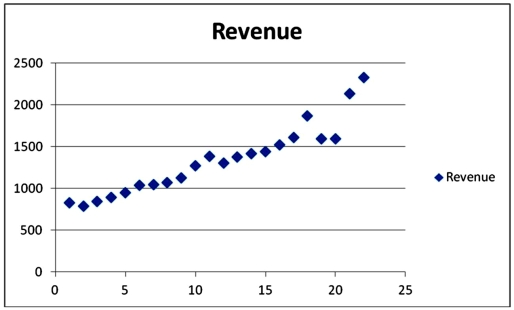 Excel scatterplot shown above indicates that the annual revenues have an increasing trend.Therefore,linear,exponential,quadratic and cubic models were used to fit the trend,and the following relevant information became available after applying linear regression.
 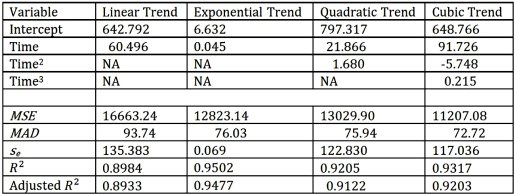 Refer to Exhibit 18.3.When three polynomial trend equations are compared,which of them provides the best fit?
A) linear
B) exponential
C) quadratic
D) cubic
Correct Answer:

Verified
Correct Answer:
Verified
Q3: Which of the following is not a
Q27: Exhibit 18.4.The following ratio-to-moving averages for the
Q29: When a time series is analyzed by
Q30: When comparing which of the following trend
Q31: Exhibit 18.5.Based on quarterly data collected over
Q36: Using the decomposition model <img src="https://d2lvgg3v3hfg70.cloudfront.net/TB2339/.jpg" alt="Using
Q37: Exhibit 18.5.Based on quarterly data collected over
Q66: In forecasting methods, the mean square error
Q76: Under which of the following conditions is
Q98: When a time series has both trend