Essay
Exhibit 18.8.Quarterly sales of a department store for the last 7 years are given in the following table. 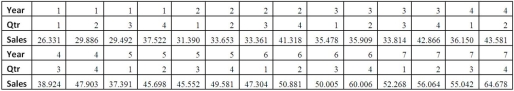
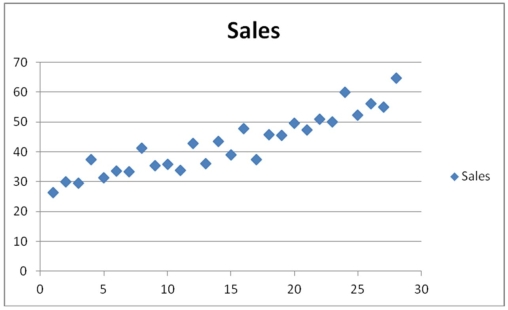 The Excel scatterplot shown above indicates that the quarterly sales have an increasing trend and seasonality.Therefore,the linear regression model,Sales = β0 + β1Qtr1 + β2Qtr2 + β3Qtr3 + β4t + ε with three seasonal dummy variables Qtr1,Qtr2 and Qtr3,and the decomposition method are proposed to make sales forecasts.For the regression model,the following Excel partial output is available.
 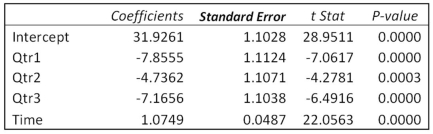 Refer to Exhibit 18.8.(Use Excel or statistical software. )Using the decomposition method,
A)compute the adjusted seasonal indices for the four quarters.
B)find the linear trend equation for the seasonally adjusted quarterly sales.
C)make the sales forecasts for the first and fourth quarter of Year 8.
Correct Answer:

Verified
a.0.9322,1.0066,0.94...View Answer
Unlock this answer now
Get Access to more Verified Answers free of charge
Correct Answer:
Verified
View Answer
Unlock this answer now
Get Access to more Verified Answers free of charge
Q1: Exhibit 18.2.The following table includes the information
Q2: Exhibit 18.4.The following ratio-to-moving averages for the
Q3: Which of the following is not true
Q4: Exhibit 18.8.Quarterly sales of a department store
Q7: Which model is considered for a quarterly
Q8: Which model is assumed for a quarterly
Q9: When the decomposition model, <img src="https://d2lvgg3v3hfg70.cloudfront.net/TB2339/.jpg" alt="When
Q10: Exhibit 18.8.Quarterly sales of a department store
Q72: When the forecasting method of seasonal dummy
Q79: The exponential trend model is attractive when