Short Answer
Exhibit 16-7.It is believed that the sales volume of one liter Pepsi bottles depends on the price of the bottle and the price of one liter bottle of Coca Cola.The following data has been collected for a certain sales region. 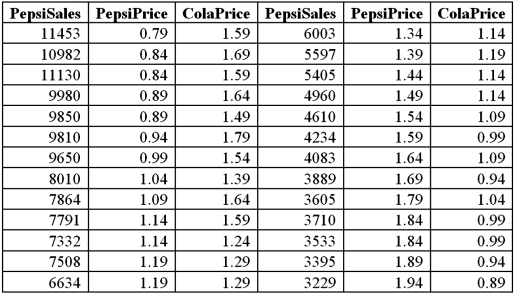 Using Excel's regression,the linear model PepsiSales = β0 + β1PepsiPrice + β2ColaPrice + ε and the log-log model ln(PepsiSales)= β0 + β1ln(PepsiPrice)+ β2ln(ColaPrice)+ ε have been estimated as follows:
 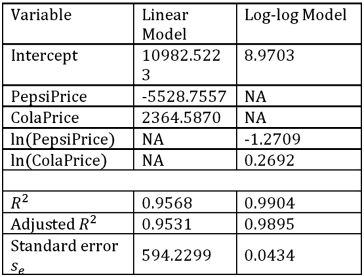 Refer to Exhibit 16.7.What is the percentage of variations in ln(PepsiSales)explained by the estimated log-log model?
Correct Answer:

Verified
Correct Answer:
Verified
Q45: Exhibit 16-4.The following data shows the cooling
Q46: Exhibit 16.6.Thirty employed single individuals were randomly
Q47: Exhibit 16.6.Thirty employed single individuals were randomly
Q48: For the exponential model ln(y)= β<sub>0</sub> +
Q49: Exhibit 16.5.The following data shows the demand
Q51: For the log-log model ln(y)= β<sub>0</sub> +
Q52: Exhibit 16.2.Typically,the sales volume declines with an
Q53: Exhibit 16.5.The following data shows the demand
Q54: The logarithmic and log-log models,y = β<sub>0</sub>
Q55: Exhibit 16.6.Thirty employed single individuals were randomly