Multiple Choice
Exhibit 14-5.An marketing analyst wants to examine the relationship between sales (in $1,000s) and advertising (in $100s) for firms in the food and beverage industry and collects monthly data for 25 firms.He estimates the model  .The following table below shows a portion of the regression results.
 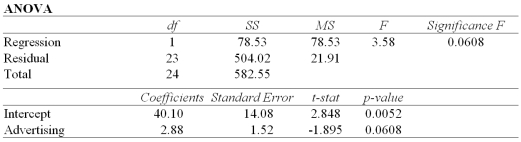 Refer to Exhibit 14-5.Predict Sales for a firm with Advertising of $500.
A) $1,480
B) $40,100
C) $54,500
D) $148,000
Correct Answer:

Verified
Correct Answer:
Verified
Q26: The positive square root of the coefficient
Q42: What is the name of the variable
Q44: Which of the following identifies the range
Q45: Exhibit 14-1.Over the past 30 years,the sample
Q46: Consider the following sample data: <img src="https://d2lvgg3v3hfg70.cloudfront.net/TB2339/.jpg"
Q49: When testing whether the correlation coefficient differs
Q50: Exhibit 14-5.An marketing analyst wants to examine
Q51: The simple linear regression model can be
Q110: A scatterplot can help determine if two
Q113: The sample correlation coefficient cannot equal zero.