Multiple Choice
Exhibit 14-5.An marketing analyst wants to examine the relationship between sales (in $1,000s) and advertising (in $100s) for firms in the food and beverage industry and collects monthly data for 25 firms.He estimates the model  .The following table below shows a portion of the regression results.
 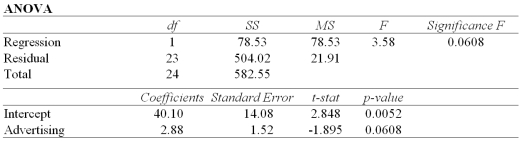 Refer to Exhibit 14-5.Interpret the slope coefficient.
A) If Advertising goes up by $100,then on average,Sales go up by $2,880.
B) If Sales go up by $100,then on average,Advertising goes up by $2,880.
C) If Advertising goes up by $100,then on average,Sales go up by $4,298.
D) If Sales go up by $100,then on average,Advertising goes up by $4,298.
Correct Answer:

Verified
Correct Answer:
Verified
Q65: Simple linear regression analysis differs from multiple
Q67: Exhibit 14-9.When estimating <img src="https://d2lvgg3v3hfg70.cloudfront.net/TB2339/.jpg" alt="Exhibit 14-9.When
Q68: Data was collected for 30 professional tennis
Q69: Consider the following data: <img src="https://d2lvgg3v3hfg70.cloudfront.net/TB2339/.jpg" alt="Consider
Q71: John is an undergraduate business major studying
Q72: The capital asset pricing model is given
Q74: Unlike the coefficient of determination,the coefficient of
Q75: Exhibit 14-10.A sociologist examines the relationship between
Q88: Compared to the sample correlation coefficient,the sample
Q139: The standard error of the estimate measures