Multiple Choice
Exhibit 12.5 In the following table,individuals are cross-classified by their age group and income level. 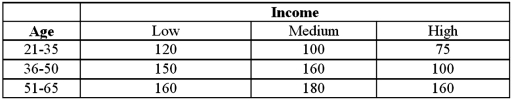 Refer to Exhibit 12.5.Which of the following is the estimated joint probability for the 'low income and 21-35 age group' cell?
A) 0.0830
B) 0.0874
C) 0.0996
D) 0.1328
Correct Answer:

Verified
Correct Answer:
Verified
Q57: For the goodness-of-fit test for normality,the null
Q58: Exhibit 12.2 A university has six colleges
Q59: For the Jarque-Bera test for normality,the null
Q60: Exhibit 12.6 The following table shows the
Q61: Exhibit 12.7 The heights (in cm)for a
Q63: Exhibit 12-1 A card dealing machine deals
Q64: Exhibit 12.2 A university has six colleges
Q65: Exhibit 12.3 A fund manager wants to
Q67: Exhibit 12.5 In the following table,individuals are
Q84: If the null hypothesis is rejected by