Multiple Choice
Exhibit 11-6.A financial analyst examines the performance of two mutual funds and claims that the variances of the annual returns for the bond funds differ.To support his claim,he collects data on the annual returns (in percent) for the years 2001 through 2010.The analyst assumes that the annual returns for the two emerging market bond funds are normally distributed.Here are some relevant summary statistics. 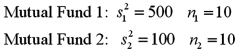 Refer to Exhibit 11-6.For the competing hypotheses:
 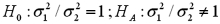 since
since  ,approximate the p-value for the test.
A) Less than 0.01
B) Between 0.01 and 0.025
C) Between 0.02 and 0.05
D) Between 0.05 and 0.10
Correct Answer:

Verified
Correct Answer:
Verified
Q7: Find the value x for which:<br>A) <img
Q8: (Use Excel)The following are the prices (in
Q9: The parameter of interest for inferences regarding
Q10: Exhibit 11-6.A financial analyst examines the performance
Q11: The following are the measures based on
Q13: For a 99% confidence level find <img
Q14: A professor analyzes the variance in scores
Q15: Construct a 95% confidence interval for the
Q16: Find the value of x for which
Q17: Use the p-value approach to conduct the