Multiple Choice
Exhibit 11-6.A financial analyst examines the performance of two mutual funds and claims that the variances of the annual returns for the bond funds differ.To support his claim,he collects data on the annual returns (in percent) for the years 2001 through 2010.The analyst assumes that the annual returns for the two emerging market bond funds are normally distributed.Here are some relevant summary statistics. 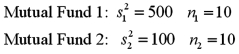 Refer to Exhibit 11-6.At α = 0.10,is the analyst's claim supported by the data using the critical value approach?
A) No,because the value of the test statistic is less than the critical F value.
B) Yes,because the value of the test statistic is less than the critical F value.
C) Yes,because the value of the test statistic is greater than the critical F value.
D) No,because the value of the test statistic is greater than the critical F value.
Correct Answer:

Verified
Correct Answer:
Verified
Q3: A random sample of 18 observations is
Q19: A right-tailed test for the ratio of
Q20: If s<sup>2</sup> is computed from a random
Q21: Which of the following Excel functions is
Q22: A researcher analyzes the returns for two
Q23: Identify the hypothesis that depicts a right-tailed
Q25: Exhibit 11-3.The following are the competing hypotheses
Q26: The result of placing a larger sample
Q28: Exhibit 11-4.Consider the expected returns (in percent)from
Q29: A two-tailed test is used to determine