Short Answer
The following table shows the heights (in inches)of individuals recorded recently for two families,the Williams' and the Thomas',in Chicago,Illinois: 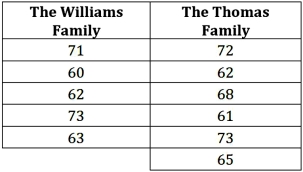 a.Construct a 95% interval estimate of the ratio of the population variances.
B)Using the computed confidence interval,test if the ratio of the population variances differs from one at the 5% significance level.Explain.
Correct Answer:

Verified
a.[0.18,12.43]
b.Rat...View Answer
Unlock this answer now
Get Access to more Verified Answers free of charge
Correct Answer:
Verified
b.Rat...
View Answer
Unlock this answer now
Get Access to more Verified Answers free of charge
Q63: Find the value x for which:<br>A) <img
Q64: The sampling distribution of <img src="https://d2lvgg3v3hfg70.cloudfront.net/TB2339/.jpg" alt="The
Q65: The value of the test statistic for
Q66: Find the value x for which:<br>A) <img
Q67: The skewness of the Chi-square probability distribution
Q67: Statistical inferences regarding σ<sup>2</sup> are based on
Q70: The following data,drawn from a normal population,is
Q71: Exhibit 11-5.Amie Jackson,a manager at Sigma travel
Q72: Compute a 98% confidence interval for the
Q73: Exhibit 11-6.A financial analyst examines the performance