Multiple Choice
A random sample of 49 cast aluminum pots is taken from a production line once every day.The number of defective pots is counted.The proportion of defective pots has been closely examined in the past and is believed to be 0.05. Refer to Exhibit 7-11.What are the upper and lower control limits for the  chart?
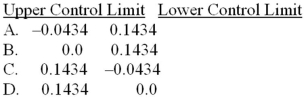
A) Option A
B) Option B
C) Option C
D) Option D
Correct Answer:

Verified
Correct Answer:
Verified
Q52: Which of the following is true about
Q71: How does the variance of the sample
Q92: The Office of Career Services at a
Q93: The labor force participation rate is the
Q94: Which of the following is considered an
Q95: If we had access to data that
Q96: In early 2012,the United States Congress approval
Q99: A school is required by the government
Q100: Super Bowl XLVI was played between the
Q102: A local company makes snack size bags