Multiple Choice
The table below gives the deviations of a portfolio's annual total returns from its benchmark's annual returns,for a 6-year period ending in 2011. 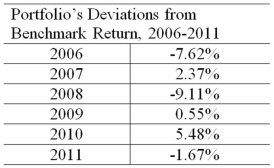 The arithmetic mean return and median return are closest to:
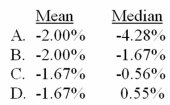
A) Option A
B) Option B
C) Option C
D) Option D
Correct Answer:

Verified
Correct Answer:
Verified
Related Questions
Q38: The terms central location or central tendency
Q57: In a data set, an outlier is
Q105: The Sharpe ratio measures the extra reward
Q113: The variance and standard deviation are the
Q114: The coefficient of variation is best described
Q117: The sample data below shows the number
Q119: A portfolio manager generates a 5% return
Q121: The median is defined as…<br>A)The middle point
Q122: Which of the following is most influenced
Q138: Which five values are graphed on a