Essay
The following data represents motor vehicle theft rates per 100,000 people for the cities of Detroit,Michigan,Newark,New Jersey,St.Louis,Missouri,Oakland,California,Atlanta,Georgia,and Fresno,California.These six cities had the highest per-capita motor vehicle theft rates in the nation in 2010. 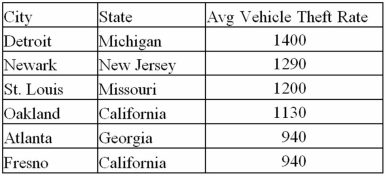 a.What is the mean and median per-capita theft rates of the above cities?
B)Given the standard deviation of the per-capita crime rate in Detroit is 200 thefts per 100,000 use the empirical rule to calculate the probability Detroit has over 1800 thefts per 100,000 next year?
Correct Answer:

Verified
a.  Median...
View Answer
Unlock this answer now
Get Access to more Verified Answers free of charge
Correct Answer:
Verified
View Answer
Unlock this answer now
Get Access to more Verified Answers free of charge
Q11: The arithmetic mean is the middle value
Q20: The coefficient of variation is a unit-free
Q55: As of September 30,2011,the earnings per share,EPS,of
Q56: In its standard form,Chebyshev's theorem provides a
Q57: Total Revenue,in $millions,for Apple Computers was 42,905
Q58: The price to earnings ratio,also called the
Q59: The sample data below shows the number
Q61: The sample data below shows the number
Q64: As of September 30,2011,the earnings per share,EPS,of
Q65: The following table shows the annual returns