Multiple Choice
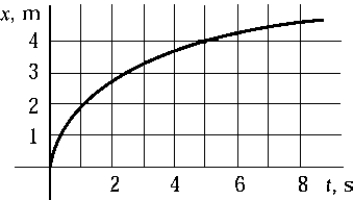 The graph shows how the position of a particle depends on time. Which choice is closest to the average speed of the particle in the time interval between 0 and 6 s?
A) 0.40 m/s
B) 0.67 m/s
C) 0.75 m/s
D) 1.50 m/s
E) 2.22 m/s
Correct Answer:

Verified
Correct Answer:
Verified
Related Questions
Q3: Two baseballs are thrown vertically up from
Q6: On a graph that shows position on
Q8: The velocity of a particle is given
Q10: The displacement of an object during any
Q16: <img src="https://d2lvgg3v3hfg70.cloudfront.net/TB6080/.jpg" alt=" Two of the
Q23: The distance traveled by a car in
Q24: <img src="https://d2lvgg3v3hfg70.cloudfront.net/TB6080/.jpg" alt=" Which of the
Q25: The change in displacement for a given
Q53: The displacement of an object for a
Q72: A balloon is ascending at a rate