Multiple Choice
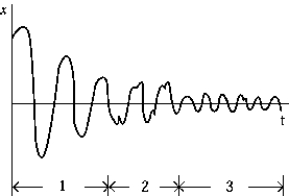 The graph shows the response of a driven oscillatory system as a function of time. The region(s) of the graph that show(s) only the transient response is (are)
A) 1
B) 2
C) 3
D) 1 and 2
E) 2 and 3
Correct Answer:

Verified
Correct Answer:
Verified
Related Questions
Q15: A 1.81-kg block slides on a horizontal
Q17: A particle moving in a circle of
Q18: A pendulum does not have simple
Q52: If the amplitude of a simple harmonic
Q82: Use the figure to the right to
Q85: A Foucault pendulum is a simple mass-on-a-long-string
Q93: When a body capable of oscillating is
Q95: A particle moving with a simple harmonic
Q106: Use the figure to the right to
Q113: A body of mass M is executing