Multiple Choice
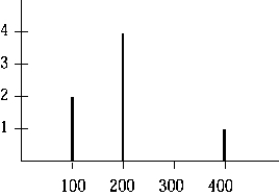 The complex wave whose frequency spectrum is shown in the figure is made up of waves whose relative amplitudes are
A) 1, 2, and 4.
B) 100, 200, and 400.
C) 1 and 4.
D) 200 and 400.
E) 1 and 2.
Correct Answer:

Verified
Correct Answer:
Verified
Related Questions
Q5: The fundamental frequency of a vibrating string
Q23: A piano tuner hears a beat every
Q28: Tuning fork A has a frequency of
Q37: The air columns in two identical pipes
Q43: A 1.00 m string fixed at both
Q46: If two identical waves with a
Q79: A string 2.0 m long has
Q83: <img src="https://d2lvgg3v3hfg70.cloudfront.net/TB6080/.jpg" alt=" The figure shows
Q87: <img src="https://d2lvgg3v3hfg70.cloudfront.net/TB6080/.jpg" alt=" The figure shows
Q89: <img src="https://d2lvgg3v3hfg70.cloudfront.net/TB6080/.jpg" alt="