Multiple Choice
Use the figure to the right to answer the next problems.
The graph shows a wave pulse of width w = 5 cm and speed v = 100 m/s. 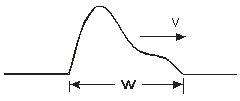
-The range of frequencies is
A) 2000 s  1
1
B) 200 s  1
1
C) 1000 s  1
1
D) 50 s  1
1
E) 5 s  1
1
Correct Answer:

Verified
Correct Answer:
Verified
Related Questions
Q7: A guitar string of length 105 cm
Q8: A vibrating tuning fork of 850
Q9: If two identical waves with a
Q20: A wire of mass 1.1 g is
Q32: Two sources are said to be coherent
Q54: The fundamental frequency of a vibrating string
Q72: A violinist is tuning the A string
Q106: <img src="https://d2lvgg3v3hfg70.cloudfront.net/TB6080/.jpg" alt=" The figure shows
Q111: <img src="https://d2lvgg3v3hfg70.cloudfront.net/TB6080/.jpg" alt=" The figure shows
Q112: In a vibrating-string experiment, three loops are