Multiple Choice
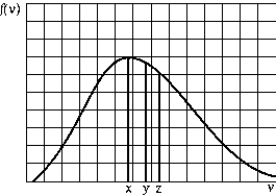 The graph shows the Maxwell-Boltzmann distribution function of the number of gas molecules per unit speed range at a given temperature. The average speed, the most probable speed, and the rms speed (in this order) are most likely given by
A) x, y, z
B) z, x, y
C) y, z, x
D) y, x, z
E) z, y, x
Correct Answer:

Verified
Correct Answer:
Verified
Q37: In a Maxwell-Boltzmann distribution function of molecular
Q42: Doubling the Kelvin temperature of a gas
Q52: A temperature of 14ºF is equivalent to<br>A)-10ºC<br>B)7.77ºC<br>C)25.5ºC<br>D)26.7ºC<br>E)47.7ºC
Q55: Use the following to answer the question:
Q60: A constant-volume gas thermometer reads 6.66 kPa
Q61: The temperature of the air on a
Q66: The highest and lowest temperatures ever recorded
Q69: <img src="https://d2lvgg3v3hfg70.cloudfront.net/TB6080/.jpg" alt=" Two tanks, both
Q70: A device used to measure the
Q72: A 1 L container contains O<sub>2</sub>