Multiple Choice
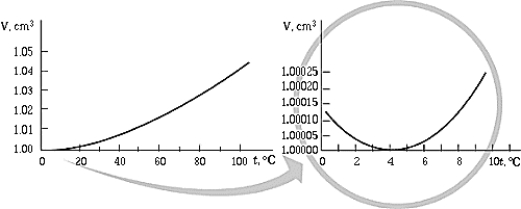 The graph shows the volume occupied by 1 g of water as a function of temperature. The graph shows that
A) for temperatures greater than 4ºC, the volume decreases with temperature.
B) the volume of the water is a minimum at 4ºC.
C) for temperatures less than 4ºC, the volume increases as the temperature decreases.
D) for temperatures greater than 4ºC, water becomes denser as it cools.
E) All of these statements are true.
Correct Answer:

Verified
Correct Answer:
Verified
Q5: In operation an aluminum flywheel within
Q6: A glass rod that is 1.0
Q11: The temperature gradient in a wall
Q33: If a piece of iron is exposed
Q35: During the evening the partial pressure of
Q41: Which of the following statements about electromagnetic
Q42: The main process by which heat is
Q45: A common trick to open the
Q46: If the absolute temperature of the filament
Q53: The length of an object varies with